Carl’s Idea

AutoStat

Darrell Russell, Carl Woodard, Heath Hurst

In the United States, residential home energy consumption accounts for roughly 20% of the total energy usage. That comes out to about ten quadrillion British Thermal Units (BTUs) used per year. As the population of the United States continues to rise this will continue to increase and place a greater strain on national and global energy markets while contributing to existing environmental issues. For this reason, it is imperative to find simple, affordable, and intuitive solutions to reduce the energy consumed by the average household.

In the U.S. about 48% of total energy consumed by the residential sector was from heating and cooling according to the U.S. Department of Energy (DOE). This means that any plan or tool conceived to help reduce residential energy usage must consider one of the largest portions of consumption. For this reason, we have chosen to focus on how to reduce overall heating and cooling costs, and by extension reduce the burden on the environment. To help achieve the greatest effect on energy usage the solution needs to introduce the smallest possible burden on the user to ensure continued use, show tangible results after implementation, have minimal impact on the daily routine of the consumer, and allow access by the widest possible population.

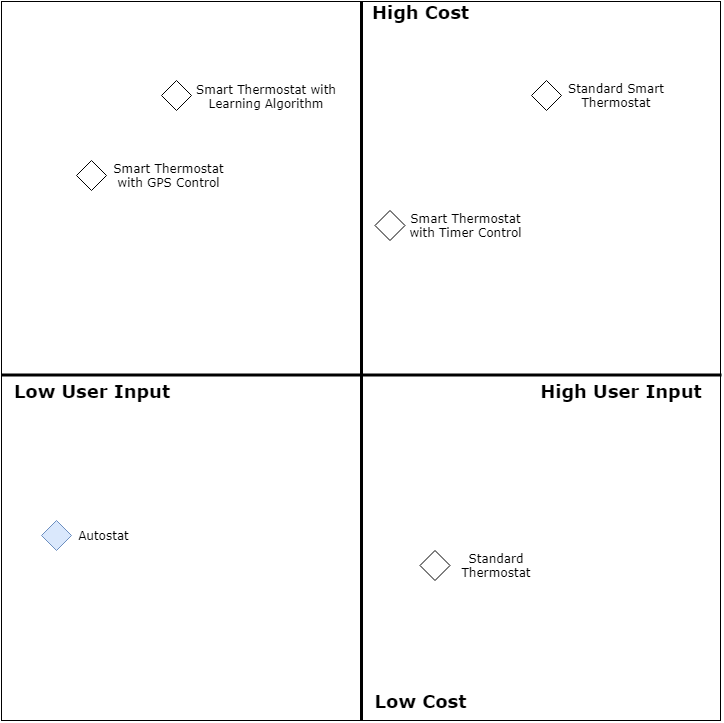
Our solution is to create an integrated control system that can replace and/or act along side of the built-in thermostat for homes with central heating and cooling. This system will be fully automated once the initial preferences are entered by the user, allow the user to assume manual control without disabling the system, account for multiple users, utilize Global Positioning Systems (GPS) during automatic control, and provide real-time or historical data for the household’s energy usage. All of these capabilities would be ineffective if the system was beyond the economic means of the average household, that being the major issue with many automated heating and cooling systems currently on the market, which is why this solution also focuses on using reliable and affordable components to reduce overall cost without compromising the ability of the system.

Design

The first portion of the system is the remote temperature monitor, constructed from a system microcontroller, electronic thermometer, and radio frequency (RF) transmitter. This allows for high accuracy temperature readings that may be taken from an area that can be more representative of the average temperature in the home than the built-in thermostat. By using high accuracy thermometers and placing the monitor in a more representative location, or in multiple locations if more than one monitor is used, the possibility of over use of the heating or cooling unit occurring because of error in low accuracy thermometers or nonrepresentative temperature samples is reduced. Also, unlike the standard thermostat used today, the monitor does not measure temperature continuously, again reducing the energy usage of the system itself. The simplicity of the monitor also allows for a reduction in cost, since RF transmitters are used rather than direct connection to the internet. Hardwiring the monitors is also unnecessary, lowering the installation difficulty and widening the possible market.

The next critical portion of the system is the GPS integration. A small, non-intrusive application is downloaded onto the user’s phone which accesses the GPS location on a regular interval. This information is used to calculate the estimated time it would take for the user to arrive home from their current location. During the initial runtime of the control program, several preferences are decided upon by the user, and may be changed at any time, two of which are the first and second preference distances (Figure 2). The first distance is the area in which one wishes the heating and cooling system to remain active, usually a short distance that would not cause a short-term fluctuation in temperature if the user leaves their house for routine errands. The second distance is recommended by the program based on the size of the home and the efficiency of the heating or cooling unit, which serves as the decision point used by the control program.

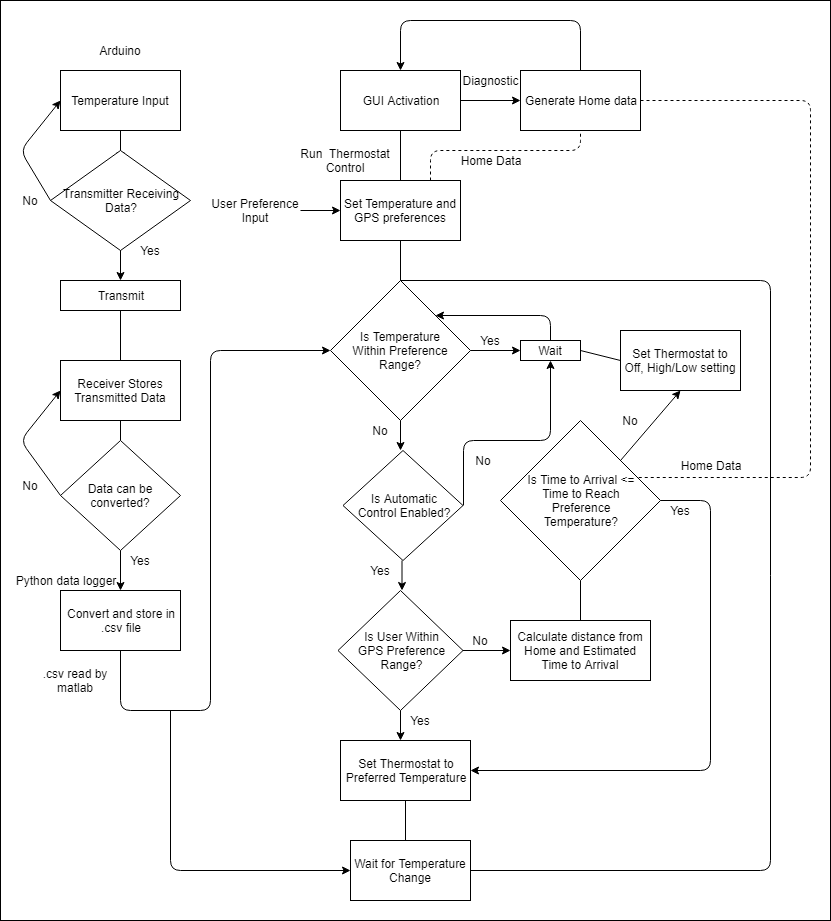
Once the remote temperature monitor collects temperature data, it is transmitted to the monitoring unit. This unit collects and converts the data so it can be processed by the system’s programming to control the home’s heating and cooling. Once the program receives the data the automatic control uses that data to set the thermostat’s temperature. However, the control program has several other inputs to consider before deciding on the thermostat’s setting. First, the system will remain idle if manual control has been chosen by the user. Second, the system checks the GPS data described above. If the user has been outside of the second distance preference, the program will reset the thermostat to the desired user temperature. If the user has been outside of the first distance preference but inside of the second, the program will incrementally move the thermostat setting closer to the desired user temperature as the user moves closer to the home. Lastly, the program will not allow one’s home to drop below, or go above, preset temperatures, included for users who have pets or sensitive possessions that require a more restrictive temperature range. The logic flow diagram (Figure 1) is included to show the process flow.

At any time the user wishes, or on a desired interval, the real-time and historic data for energy usage may be accessed, either as tables or graphs. This however is an abstract body of information. To make the data more tangible to the user, the estimated cost of electricity is used to convert the energy used to money spent, which will be the default setting for display. Also, a separate counter will be shown while accessing the data, showing how much money has been saved by using the automated system instead of constantly heating one’s home.

Effect

This system is designed to run completely in the background, functioning without further user input past the initial entering of preferences and diagnostic test used to calculate the home’s air mass. Since one of the major barriers affecting the usage of automated heating and cooling systems, even with individuals who already own or have installed smart home devices, is the need for continued input from the user, this system aims to eliminate user input. Removing this necessity will increase the likelihood of continued use and savings in energy consumption. Having a fully automated program also removes some of the excess energy use introduced via human error. It is not necessary to remember to reset the house’s thermostat before leaving home, or going on vacation, as it would for other automated control systems. Also, there are no set time intervals for the house to be heated or cooled, meaning that if the user deviates from their normal schedule their home will not be heated or cooled unnecessarily, nor will they arrive home to find the temperature far above or below their preference temperature. All these factors culminate in this system being invisible, intuitively controlling the temperature and regulating home energy use without affecting the daily lives of the users. We believe with the combination of minimal user input and low cost, this solution stands out from market available alternatives.

Cost to F Value

Logic Flow

Preference Distances


Sarah’s Idea

Home Energy Score Interactive Dashboard

Problem Statement and Our Solution

Energy efficiency is difficult to observe. As a result, it is hard to value. According to the Shelton Group, 89% of people who expect to buy a new home in the next two years indicated higher energy efficiency would factor into their decision making (Shelton Group Energy Pulse, 2017). Yet, many homeowners do not know how to communicate energy efficiency and 84% have little knowledge about how to make a home more energy efficient.

The Department of Energy’s (DOE) Home Energy Score (HES) System seeks to solve this problem by creating a standardized energy assessment score that can credibly signal the value of a home’s energy assets. However, the HES system can be improved––the DOE faces a lack of data collection concerning the effects of the HES on homeowners’ perceptions, understanding, and interaction with the HES. Providing a score is not enough to encourage its use. The score must be effectively communicated, and homeowners’ responses need to be evaluated to monitor its effectiveness. The more engaged and knowledgeable homeowners are about their score, the better they can communicate it to potential buyers and the more they will value it when purchasing a home.

Our proposal is to present the HES in an interpretable and interactive manner to homeowners through an online dashboard with two features: 1) contextualizing the HES by incorporating messaging techniques, and 2) helping users understand how to improve their score via goal setting and progress tracking. Our intervention will help the DOE track this information and aid the homeowner in understanding the HES. We propose to leverage the HES data more effectively and help the DOE collect more useful data. Our intervention involves multiple features to provide the homeowners with a comprehensive understanding of the HES. In the long run, our dashboard will reduce information asymmetry in the real estate market by educating homeowners on their score, and consequently, household energy efficiency in general. This will help formalize the HES as a variable that influences prices in the real estate market.

Background

Studies that attempt to reduce energy consumption in residential households make it clear that sustainably changing human behavior is difficult (Alcott & Rogers, 2014). Long-term daily behavioral interventions are even more difficult to induce. However, demonstrated plasticity of certain behaviors such as appliance maintenance and purchasing decisions indicate that homeowners often adopt non-invasive interventions, which may still yield significant energy savings (Dietz et al., 2009). Consequently, focusing interventions on changing homeowners’ household assets might be the best use of resources, as this involves a one-time investment decision; thus, we chose to expand upon the HES system, which focuses on home energy assets.

The HES seeks to provide a label for household energy efficiency to serve as a credible signal in the real estate market. The potential impact of the HES rating system is huge, as is illustrated by the success of the EnergyStar program labels in the market for appliances, which annually saves as much electricity as used by 30 million homes (ACEEE, 2018). However, the HES system could improve by utilizing messaging and goal-setting to allow homeowners to interact with their scores. Studies have demonstrated that distinct types of behavioral messaging are critical to fully realize the value of providing people with additional information (Crosbie and Baker, 2010). Evidence also suggests that interest in energy-saving programs is driven by consumers’ recognition of their present bias and that goal setting effectively reducing energy consumption when goals are achievable (Harding and Hsiaw, 2014). When their goals are achievable, consumers reach savings of nearly 11%, which are substantially higher than those choosing very low or unrealistically high goals. Our proposal highlights the potential for growth that will come from combining the HES with an interactive dashboard that incorporates messaging and goal-setting methods.

Dashboard

The dashboard we propose has three sections. The topmost section is a visualization of the user’s HES with a link to view and share (via email, real estate listing website, etc.) their HES report. This section provides no additional information from what the DOE provides.

The first treatment for the experimental design is located on the left side of the dashboard and focuses on messaging to contextualize the user’s HES score. In this section, we have three messaging types to interpret energy efficiency in terms of: 1) environmental and health concerns, 2) economic impact, and 3) global normative comparison.

The second treatment is located on the right side of the dashboard. It is designed to encourage homeowners to invest in their home and help them set goals for doing so. This allows users to track progress in their score without needing repeated assessments. Users are guided to set goals for their score and track subsequent changes in their home’s energy efficiency. Once a user inputs a goal, they are given information about which areas of their home can be improved to help achieve their goal. The guidance is divided into sections similar to the HES report: Roof/Attic, Foundation, Walls, etc. The user can personalize their plan by inputting specific “what if” upgrades to see how their score will change with specific improvements (Figure 2). Resources are also provided to guide the user to companies and websites offering additional information or services. For more information about our dashboard and its functionalities, refer to the Appendix attachment.

Methodology

To evaluate our intervention, we propose a matched pairs experiment. The control group receives the HES as is currently presented. Because our dashboard incorporates multiple interventions, we want to test each intervention. Consequently, our treatment group is divided into three sections: one with access to the full dashboard (Figure 1), one with access to the messaging (Figure 3), and one with access to the goal setting (Figure 4).

We propose conducting the study in Portland, Oregon, because in January 2018, Portland adopted a policy making the HES mandatory for sellers of single-family homes. Targeting cities with mandatory policies means our study has a larger, more easily accessible sample. Once the pilot study is completed, the study can expand to Berkeley, California, Austin, Texas, and Boulder, Colorado, which have similar policies.

As the program expands, homeowners will be randomly assigned to a control or treatment group. Every three months for a year following the assessment, participants will take a survey to assess the homeowner’s: a) understanding of, b) opinions of, and c) behavioral changes in response to the HES (Figure 5). From the survey, a composite score will be calculated to reflect the user’s overall “interaction” with the HES. The interaction scores and dashboard engagement analytics will be compared between the control and treatment groups across households with the same initial HES. A threat to this method is the risk of non-response. Potential solutions to address this include email reminders about the survey and possibly for the DOE to subsidize the HES to study participants, conditional on their completion of the surveys.

According to the Portland Tribune, 2,036 homes have been scores since implementation of the HES policy. We use this to estimate the size of our sample population:

Control: 1018

Messaging Treatment: 339

Goal Setting Treatment: 339

Full Dashboard Treatment: 340

DATA

The primary data in our dashboard comes from the HES report and information from the DOE on specific products and appliances. Our dashboard will collect a range of data, including demographic and investment/upgrade information, from homeowner inputs. The survey will provide feedback on upgrades and qualitative data on participants’ opinions of the HES. With this information, the DOE can study general receptiveness to the score and track patterns in investment behavior across demographic groups. Lastly, dashboard analytics will be collected to track user engagement, which serves as a metric to measure how often users actually interact with the intervention.

Impact

In the short run, the dashboard will help homeowners understand their score. This will help legitimize the score to homeowners, which is a crucial step in making the HES relevant in the real estate market. The dashboard will also help homeowners identify specific improvements and investments to increase their score. We expect that this access to easily digestible and interactive information will alter the habits of homeowners while educating them on the specifics of the HES.

In the long run, the dashboard will help reduce information asymmetry in the real estate market by educating homeowners. The more engaged and knowledgeable homeowners are about the HES, the more useful it will become for both parties in the real estate market. This will aid in expanding the HES program and formalizing the HES as a variable that influences prices in the real estate market. Lastly, our intervention has the potential to significantly reduce carbon emissions. We project that if the Portland homeowners in the treatment groups of our study, on average, reduce their HES by two points, this will lead to a monthly CO2 emissions reduction of 424,000 pounds. As the HES initiative expands, this could potentially generate a monthly reduction of almost 7,000,000,000 pounds of CO2 (EPA Household Carbon Footprint Calculator).

Sources:

American Council for Energy-Efficient Economy (ACEEE). “The Impact of Federal Energy Efficiency Programs.” 2018. https://aceee.org/sites/default/files/pdf/fact-sheet/impact-federal-ee-programs.pdf.

Asensio, Omar Isaac and Magali A. Delmas. “The effectiveness of US energy efficiency building labels.” Nature Energy, 2017. http://www.asensioresearch.com/uploads/1/2/8/8/12883280/nenergy201733.pdf.

Brounen, Dirk, and Nils Kok. “On the economics of energy labels in the housing market.” Journal of Environmental Economics and Management, 62, 166–179, 15 April 2011. https://ac.els-cdn.com/S0095069611000337/1-s2.0-S0095069611000337-main.pdf?_tid=ca647fa6-7f35-4ddd-b088-f5e3d1cd1742&acdnat=1543345704_6a474fd2d0e3692c6fb608ddef3c8aa5.

Dietz, Thomas, Gerald T. Gardner , Jonathan Gilligan, Paul C. Stern, and Michael P. Vandenbergh. “Household actions can provide a behavioral wedge to rapidly reduce US carbon emissions.” Proceedings of the National Academy of Sciences of the United States of America, 106(44), 18452–18456, November 2009. http://doi.org/10.1073/pnas.0908738106.

Delmas, Magali and William Kaiser. “Behavioral responses to real-time individual energy usage information: A large scale experiment.” March 2014. https://www.arb.ca.gov/research/apr/past/10-332.pdf.

Harding, Matthew and Alice Hsiaw. “Goal setting and energy conservation.” Journal of Economic Behavior & Organization, Volume 107, Part A, November 2014. https://ac.els-cdn.com/S0167268114001176/1-s2.0-S0167268114001176-main.pdf?_tid=c395aaa0-ed3e-45be-861a-00bbe103617b&acdnat=1543278521_5bbf26d23c15abe126fae3d53fc0fed8.

Kahn, Matthew E. and Nils Kok. The capitalization of green labels in the California housing market. Regional Science and Urban Economics (47), 25-34, July 2014. https://doi.org/10.1016/j.regsciurbeco.2013.07.001.

Shelton Group. Energy Pulse 2017. Jump into STEM Round 1 Webinar 2, 2018. https://sheltongrp.com/.

Zheng, Siqi, Jing Wu, Matthew E. Kahn, and Yongheng Deng. “The nascent market for ”green” real estate in Beijing.” European Economic Review, 56, 974–984, 3 April 2012. https://ac.els-cdn.com/S001429211200030X/1-s2.0-S001429211200030X-main.pdf?_tid=74c5b877-1589-42d3-8c0e-837b2d8e5b78&acdnat=1543345706_525cbeea81dee8f5f7b781c46a735385.

HES Dashboard

Appendix

HES Interactive Dashboard


Cade’s Idea

Behavioral Incentives – Reducing Energy Consumption for 65+

Older adults households (made up of persons aged 65+) are often not specifically targeted as energy wasters, however, older adult households use 36 percent more energy compared to households comprised of persons younger than 65 nationwide. Despite being the fastest growing segment of the population, older adults have been understudied in behavior based energy studies. Behavioral interventions are expected to reduce energy consumption among older adults by up to 20 percent (35 billion kWh per year). This study proposes a randomized encouragement design with two interventions to reduce energy consumption among older adults. We propose a new class of interventions that use generative messages about intergenerational impacts, based on behavioral theories from social psychology. We compare generative interventions to a well-studied policy intervention, financial incentives. We hypothesize that the use of generative messages can be a low cost means to reduce energy consumption with a potential savings of $4.2 billion per year.

Full Proposal


An Approach to Energy Reduction

The idea represented in this design paper involves a close examination of current energy expenditure of residential buildings, particularly in marginalized areas. Sponsored by partners at the National Renewable Energy Lab (NREL) as well as Oak Ridge National Laboratory, students are tasked to come up with unique low-cost and easily implemented solutions to achieve optimal comfort while also reducing energy usage in residential buildings. This was achieved by learning current methods and usage figures. The specific design challenge is to then figure out how to utilize/modify current sensors in the home to aid in energy reduction efforts. Included in this design is an overview of energy problems and an evaluation of current methods with a proposed plan to make them better.

Eco-Life Home System

The goal of the JUMP STEM online building science competition is to come up with a innovative idea in three categories; Smart Sensors and Controls for Residential Buildings, Designing a Healthier and Energy-Efficient Air Distribution System or Pushing the Envelope with Wall Retrofit Designs. The topic I will focus on will be Smart Sensors and Controls for Residential Buildings. In this paper I will pitch about a new and innovative home Smart sensor and controls system that I design. I will break all its features and show how it can improve the homeowner’sway of life. My adaptable system not only will create a comfortable atmosphere for the homeowner but will also gradually steer their mindset into a more Eco-conscious way of life.

Eco-Life Home System

The problem with current systems is that it is too complicated for users to use even though the system tries to adapt to users. With the Eco-life home system, it will be able to adapt to the user’s lifestyle. Featuresthat would be included in the household system design is a function to detect body language, different modes, and to overall translate the user into Greener/energy efficient mindset.The first feature of the Eco-life home system is the body language detection of the user. This feature will analyze the users heart rate, blood pressure, and local temperature of the surrounding area and predict how they are feeling.System would gather all this information from a smart device that is provided with the system or a smart watch that user previously has. This is essential because this will allow the system to generate a positive atmosphere based off the reading of the user’s mood. For an example if the user had a bad day, the system will flag this and create an atmosphere that will cheer them or make them feel comfortable. Along with analyzing the user’s body, the system will be able to predict the perfect temperature to set the home to based off the surrounding outside temperature, the user’s step, and user’s heart rate. For an example if the user is running errands during 88-degree weather, the house will know to set the temperature for the user to 73 degrees so that they can cool down once they get into the house. A plus to this design is that it will decrease energy use in the home. The second feature in the Eco-life home system are the different modes that are programmed into the system. The first mode is the Down time Mode-It is a mode that allows the user to relax after a long day. The way this is possible is by setting the lighting at a low dim setting or a cozy temperature setting. The benefits of this setting are that it allows the user to relax and saves the user by reducing the electrical use in lighting and hvac. The second mode is the All-Nighter mode which is a mode that allows the user to be comfortable and stay productive at any time of the day or night. The way this is possible is by setting the lighting at a higher brightness in a way that will affect their circadian rhythm. For example, if the user has a deadline at work, this mode would create the perfect atmosphere for the user to stay up and alert. These modes can be easily reconfigured by the user. In addition, the user can assign these modes setting to specific space or zone in the house. Also, if the user would like to improve the effectiveness of these modes, the home system will be compatible with Led color changing lights. This would be ideal because it will allow the system to change the temperature of the light in a space.Lastly, the systems has a feature to help push the user into a greener/energy efficient mindset. It does this by setting goals for the user to accomplish through showing them current energy usage, current energy saved, and possible energy saved through cost if they change one or two habits. For example, if the user watches an average of 20 hours of TV in a week and their energy usage for TV is $100, the system will suggest limiting TV time to 10 hours. By doing this the user would save $50 worth of energy. In addition to setting goals for the user, the user can also sync the calendar with the system. This is a plus is because it will allow the system to prepare for big events at the user’s home. The way the system can prepare is by calculating the number of people attending the event, the local temperature, and other factors in order to know what the perfect temperature settings would be for the space.In the US for Single-family attached and detached home unit types there are a total of 80.9 homes and 31.1 homes set one temperature and leave it there most of the time and only 16.7 program the thermostat to automatically adjust the temperature during the day and night at certain times. This shows that 38% (which is the highest percentage) of homes in the US are possibly wasting energy in running HVAC systems.Overall, the Eco-life home system is a user-friendly home system has great features. It predicts the user’s body language in order to custom design a perfect positive atmosphere for the user. Allows the user to set different modes such as down time and all-nighter modes design will assist the user in achieving both total relaxation and productivity. With the combination of all the features, this comprehensive system will overall work with the user and help the user stay on a more energy efficient track.

Design a Smart Thermostat Using FPGA Device

A Thermostat/Lighting Controller that will allow a user to monitor and control the smart lights installed around the home via an easy to use touchscreen interface, mobile application, or web application. The device will use Machine Learning and Artificial Intelligence to learn a users habits and make decisions based on the patterns it picks up. It will also make decisions that will save energy as well as prompt users about how to cut down their energy costs.

Timer

Lorem ipsum dolor sit amet, consectetur adipisicing elit. Ipsum deserunt officiis suscipit quod corrupti eum voluptatum, magnam recusandae, quam accusantium laborum aperiam blanditiis at, sunt. Laboriosam harum sunt doloribus omnis.